This week, we return to more practical simulation advice regarding AnyLogic. Have you ever wondered about the “Action Chart” library and what purpose it serves? Let’s explores what it can do for you and how it differs from normal “Function” objects. Be sure to read the cautionary advice at the end: Action Charts can cause serious problems if you are not careful!
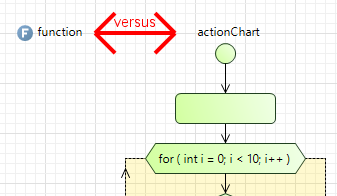
This post explores AnyLogic Functions versus Action Charts...
Empty space, drag to resize
But let’s start on a lighter note: Action Charts are a very useful addition to AnyLogic. In essence, they are visual algorithms that help you to define computations with less code writing. At their core, they are the same as AnyLogic Functions:
- they execute an algorithm when called
- you can define input arguments that are accessible in the Action Chart
- You can return something you calculated (or nothing, it’s your choice).
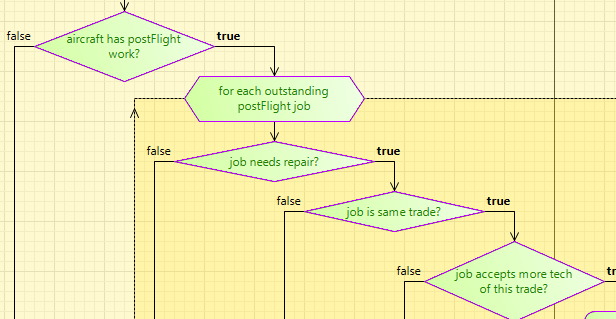
Good descriptions help the Action Chart visualization
Empty space, drag to resize
But then, a large part of your work is not writing code but drag’n’drop Action Chart blocks. So in contrast to functions, you add a visual representation of your algorithm, which can be extremely useful (see below). You replace if-functions, for-loops, while-loops and local variables with graphical blocks that “snap” into each other. Crucially, you can construct any level of complexity with these blocks.
Another neat feature is that your Action Chart blocks can be filled with descriptive text, completely removing code from your eyes (even when it’s needed in the background). Clients love this as they can follow what’s going on!
In AnyLogic, you can drag’n’drop a “Function” object from the Agent library. In the background, what happens is that AnyLogic writes a plain old Java function for you.
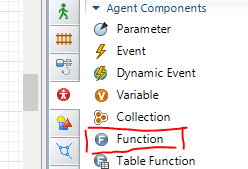
You can drag in a Function, essentially letting AnyLogic write code for you.
And as with action charts, you execute it when calling it, you can define arguments and return something. In AnyLogic, you can define it as I explained above or you can code it via pure Java code in the “Additional Class Code” section in the properties of an Agent class.
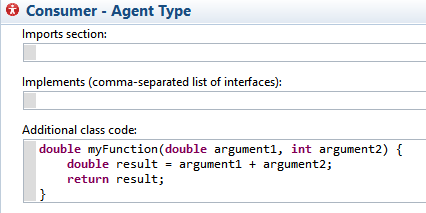
Functions can be coded in pure Java, if you prefer.
Empty space, drag to resize
To reiterate: Anything you have done with your plain old Java function can be done with an Action Chart. However, the Action Chart representation is more visual, leading to several advantages:
- it is easier to “read” your algorithm when returning to a model you haven’t seen for a while, trying to remember what is going on
- It is easier to explain what happens to a client. They can follow the “code” themselves (even when not used to programming) and discuss it with you
On the other hand, a Function requires far less space and displays the code straight away (no need to click through the different Action Chart blocks one after the next). This can helpful in understanding *quickly* what is going on.
As a general rule, I’d suggest this:
- Use the Function for very short algorithms (1-6 lines) that do a simple thing and have no nested loops. It will be easier to read them, take less time to build and save valuable screen space
- Use Action Charts for critical algorithms of medium complexity that need to be explained to clients or colleagues. Also use them for complex algorithms with many nested loops. It will help you stay sane.
In my experience, there is a limit to Action Charts displaying complex algorithms, though: if it becomes so large as to span several screens and you need to scroll a lot to even follow what is going on, it is better to return to Functions instead:
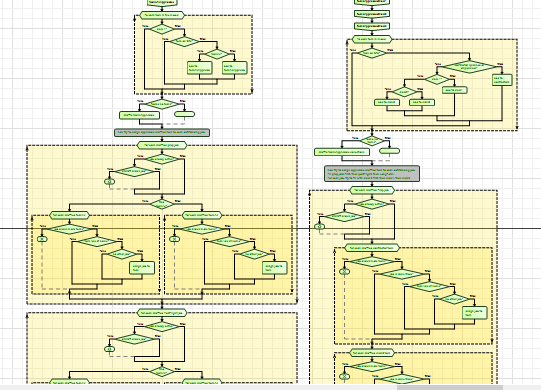
Action Charts can be become too complicated. It might better to return to Functions or split the algorithm.
Empty space, drag to resize
Another good use of Functions over Action Charts is if your algorithm is just a linear set of operations without loops or nesting. Here, you’d end up with one long Action Chart which is useless.
I have found Action Charts very useful but you need to beware of a significant short-coming: If you develop your model with other developers using versioning tools and merging (SVN, GIT…), Action Charts do not behave well and mess up your merges easily. Sometimes it’s enough to just move their location a little. Avoid them in such cases.
Action Charts are extremely useful and should be used a lot. They are visual, helping you and clients understand what is happening. However, for very simple and very long algorithms, revert to Functions. Also, avoid Action Charts when building models with versioning software!